| Age distribution Delft (+ prognosis) |
|
|
|
|
|
|
|
|
|
|
|
|
| |
|
|
| age |
|
prognosis |
in-/decrease |
|
| |
|
|
2001-2005 |
|
| |
1-1-2001 |
1-1-2005 |
in % |
|
| |
|
|
|
|
| 0-14 |
15.185 |
14.970 |
-1,4 |
|
| 15-29 |
24.256 |
23.120 |
-4,7 |
|
| 30-49 |
30.120 |
29.925 |
-0,6 |
|
| 50-64 |
14.320 |
15.900 |
11,0 |
|
| 65+ |
12.560 |
12.535 |
-0,2 |
|
| |
|
|
|
|
| total |
96.441 |
96.450 |
0,0 |
|
| source:
Registry Office and ICT/Research & Statistics |
|
|
|
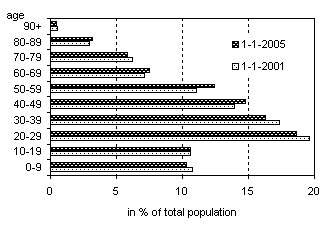
| Prognosis
age distribution Delft |
|
|
|
|
0-9 |
10-19 |
20-29 |
30-39 |
40-49 |
50-59 |
60-69 |
70-79 |
80-89 |
90+ |
|
|
1-1-2001 |
11 |
11 |
20 |
17 |
14 |
11 |
7 |
6 |
3 |
0 |
100 |
|
1-1-2005 |
10 |
11 |
19 |
16 |
15 |
12 |
7 |
6 |
3 |
0 |
100 |
|
|
|
|
|
|
|
|
|
|
|
|
|
|
|
|
|
|
|
|
|
|
| source:
Registry Office and ICT/Research & Statistics |
|
|
|
|
|
|
|
|
|
|
|
|
|
|
|
|
|